US corporates continue to do well. In 1Q18, they are likely to post sales growth of 9% and a new high in margins. Those profits are being reinvested for future growth.
Investors are worried about rising interest rates. They shouldn't be. Especially from current (low) levels, rising rates have coincided with rising equity prices. That has been the case as far back as the 1940s. The FOMC is very likely to raise rates again in June; since 1980, equities have peaked after the final rate hike.
* * *
After rising two weeks in a row, US equities fell gain this week. April ends on Monday and barring a massive drop, the month will close higher for the first time since January (from Alphatrends.net). Enlarge any chart by clicking on it.

US equities surged 7% in the first three weeks of 2018. This came on top of a 20% gain in 2017 and a 10% gain in 2016. Since then, equities have fallen 10%, risen 10%, fallen 9% and risen 5%. On a net basis, four months into the year, equities are close to flat so far in 2018.

Occam's razor says that the simplest explanation is usually the correct one: in this case, after a rapid, largely uncorrected rise, equities are now probably just consolidating within their uptrend. Extremes in momentum (top panel), volatility and sentiment are being reset before equities continue higher.
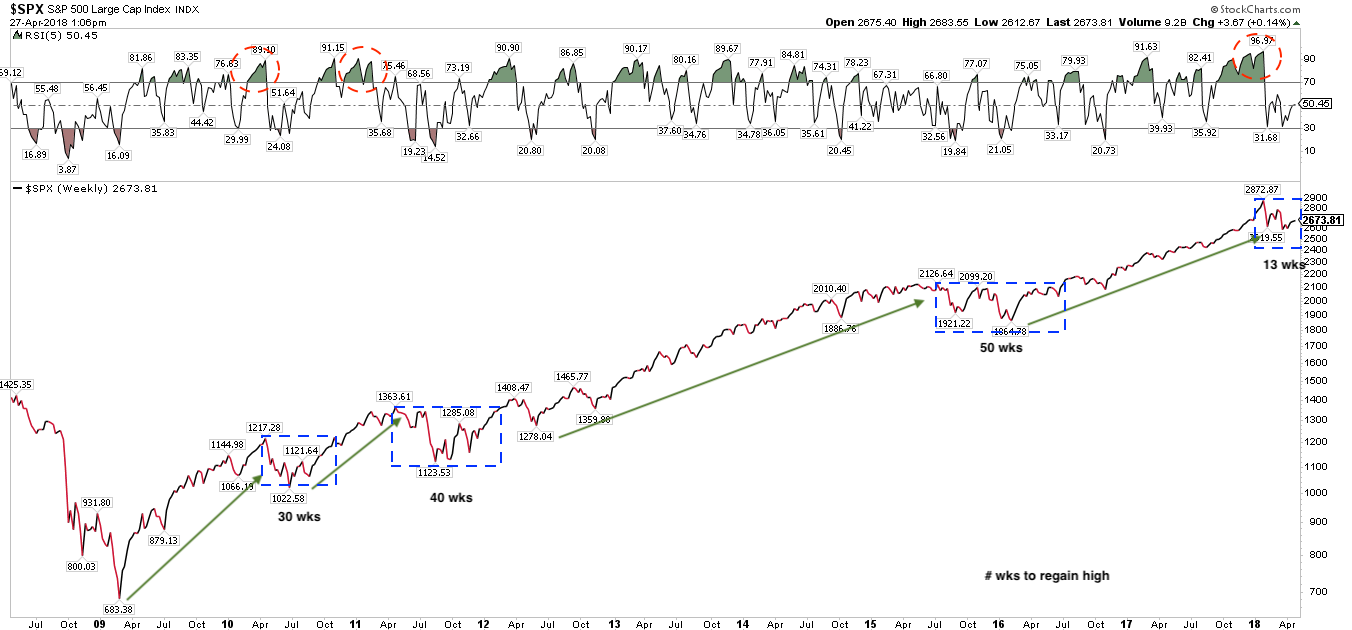
This has been a repeating pattern during this (and every) bull market, with the time between new highs ranging from 30-50 weeks. While the current consolidation might feel interminable, it is just 13 weeks old. In other words, this could go on for several more months.
The 2016 drop scared many investors into believing a bear market had begun. 2017 was the opposite, a year of nearly unparalleled calm. 2018 has been the opposite of that, with wild swings and resurgent bear market fears. This is exactly how equities operate, oscillating between trend and calamity, perpetually keeping investors off balance.

The closest parallel to 2017 is 1995; in both cases, markets ground higher with the maximum intra-year correction being a scant 3%. 1996 started with a 9% gain in January (versus 7% in 2018); between February and September 1996 (30 weeks), equities chopped in a range and consolidated gains before resuming the trend in the 4th quarter.

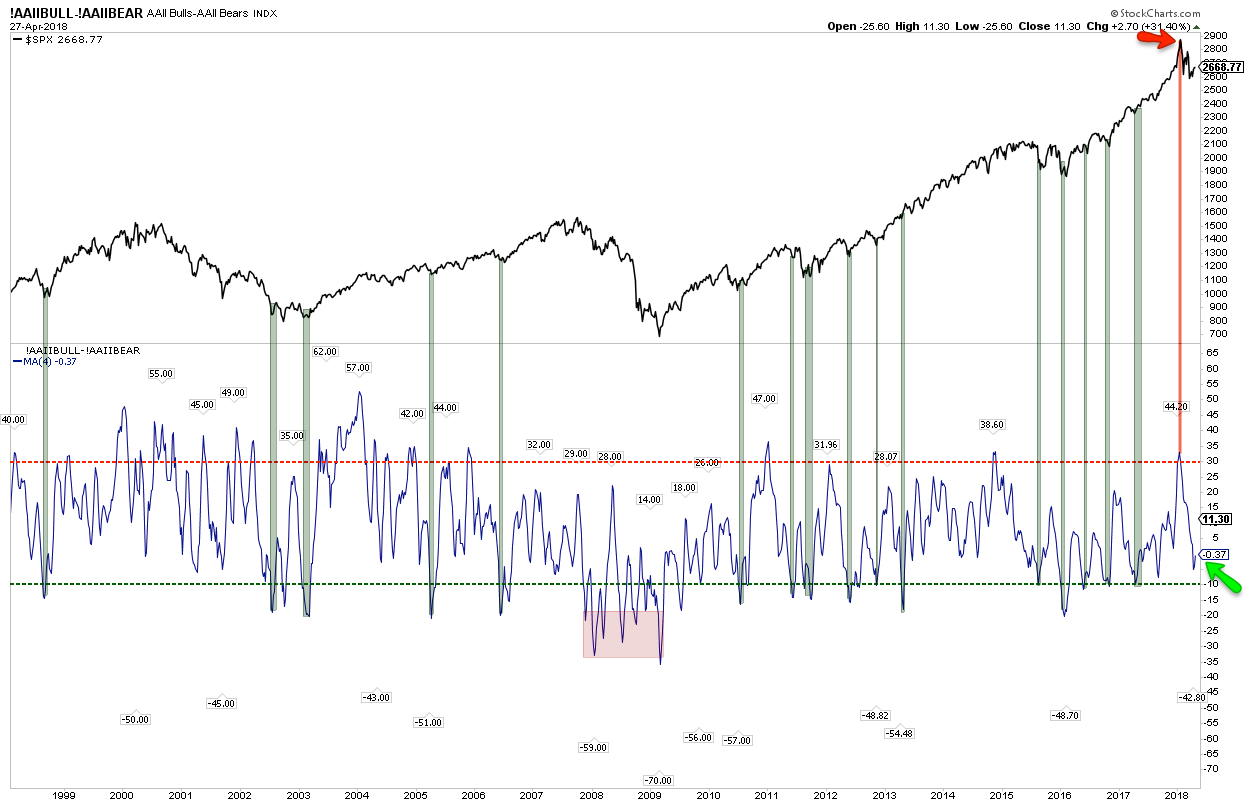
In real-time, most of 1996 was frustrating. That has the strong tendency to turn investors bearish, even if the intra-year drawdown is minor. Between February and September 1996, the one-month AAII bull-bear spread fell from +30% to -5%. This year, equities peaked after the bull-bear spread reached +33% in January (red line and arrow); at the recent low, the spread was -5% (green arrow). It's not a washout low (green lines), but it's hard to suggest sentiment hasn't been mostly reset. Another drop in price or more weeks of chop will likely pull sentiment into a full washout.
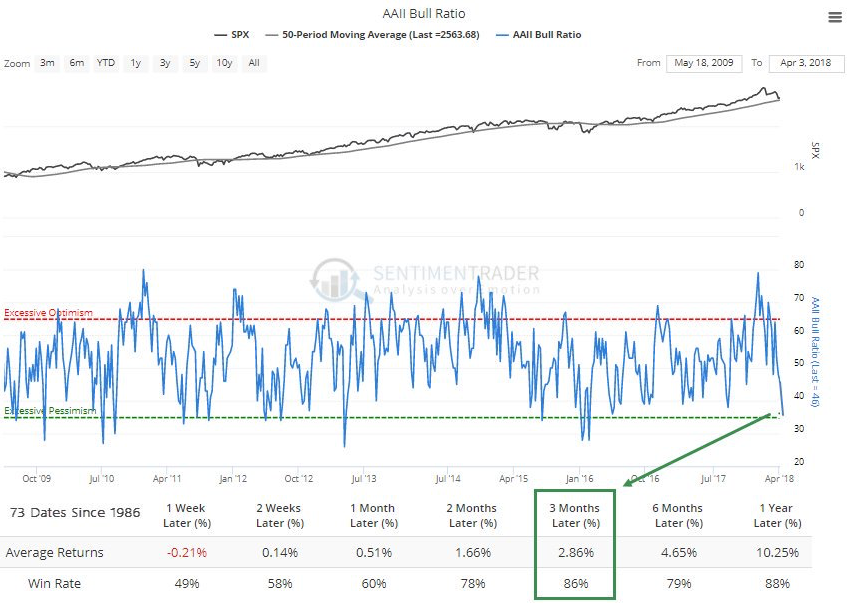
The forward equity returns from current sentiment are overwhelmingly positive. Since 1986, SPX has closed higher 3 months and 12 months later in 86-88% of instances (from Sentiment Trader; to become a subscriber, click here).
Likewise, consumer confidence that the stock market will be higher a year from now was at a 15-year high in January. Now, a majority expect the market to be lower in the next year. Outside of bear markets (2000-03; 2007-09) and near bear markets (1998; 2011; 2015-16), the current reading is within spitting distance of a low. It's not quite a washout, but it's getting close (from the Conference Board and Bloomberg).

Three weeks ago, one-month volatility (VIX) was 21. Our post that week argued that volatility was likely to fall (here). In the event, VIX is now 30% lower. Remarkably, speculators remain positioned net long Vix futures to a near record extent (orange line). In the past decade, that has reliably coincided with more near term downside in volatility (blue line; from Movement Capital).

So far this year, we have represented a number of momentum studies that suggest a new high in equities is still ahead. These studies remain relevant. A recap:
In February, DJIA ended the third longest streak above its 50-dma in the past 100 years. The end of prior streaks has never led directly to a bear market, meaning a new high was still ahead.
In February, SPX ended a 15-month win streak (total return basis), tying the record from 1959. In the past 100 years, these long streaks have never marked the end of a bull market. SPX has continued to rise at least another year in all prior instances.
Both SPX and DJIA rose more than 8 months in a row through January (excluding dividends). What happened next? Since 1900, within 6 months, the indices closed higher than in the month the streak ended every time.
In April, SPX ended a 440 day streak above its rising 200-dma. The end of streaks longer than 250 days has not coincided with the start of bear market since 1962. In the past 56 years, equities have returned to prior all-time highs.
There are never guarantees, but the odds of equities returning to their January highs at least once in the months ahead is very good.
In the short run (daily, weekly and even monthly), equities are highly influenced by investor psychology. But in the long run, equities rise and fall with fundamentals.
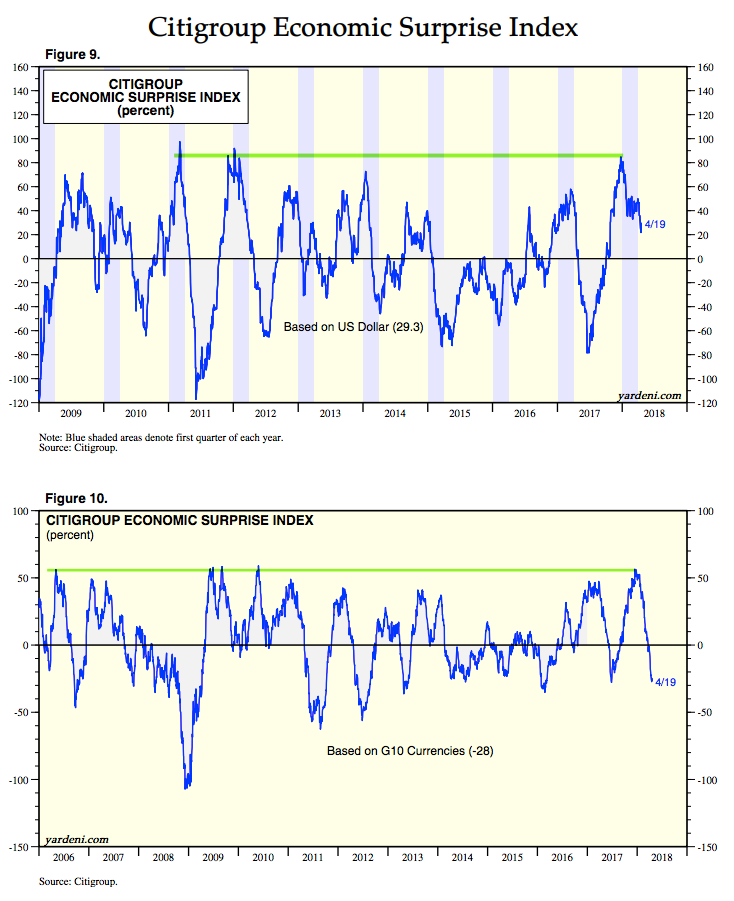
2018 started with macro economic expectations at a 6-year high. Expectations were too high and were thus bound to disappoint in the months ahead. That process remains underway (from Ed Yardeni).
Recent macro economic data supports a positive equity market through at least the next half year. A recap:
Employment: Unemployment claims are at a 48 year low.
Compensation: 1Q18 employment cost index grew 2.9% yoy, the highest growth in the past 10 years.
Demand: 1Q18 GDP grew the fastest in 2-1/2 years. Trucking tonnage is up 7.4% yoy through March (chart below from Yardeni).
Housing: In March, new home sales grew 9% yoy and starts grew 11% yoy to the highest level in 10 years.
Manufacturing: The manufacturing component of industrial production grew at the highest rate in 6 years last month.

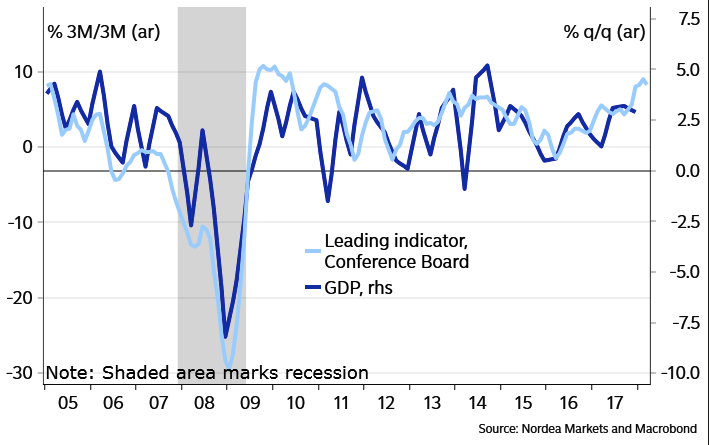
According the Conference Board's index of leading economic indicators, prospects for growth in the months ahead are strengthening (from Nordea Markets).
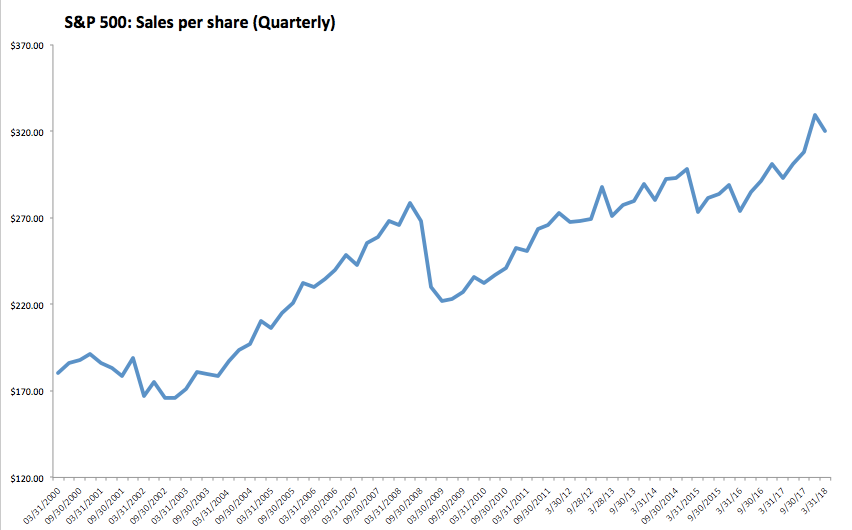
Not surprisingly, companies are doing well in this environment. About 60% of the companies in the SPX have reported for 1Q18. Sales growth is tracking +9% yoy ...
... profits are up +28% (GAAP-basis) and ...

... operating margins are at a new high of 11.7%.

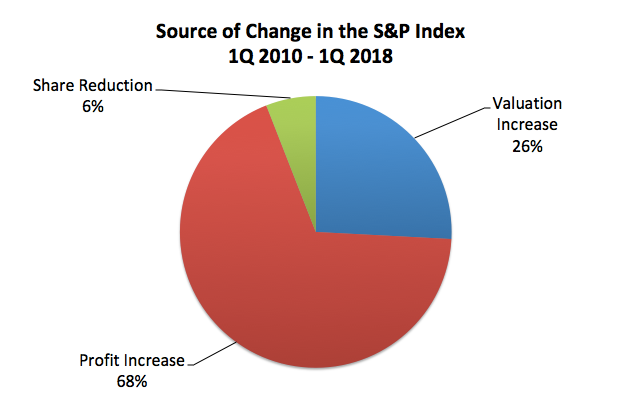
Rising profits mean that equities are appreciating primarily on the back of better fundamentals, not higher valuation premiums. That, in turn, implies further equity price appreciation before valuations become extreme.
Contrary to a persistent meme, corporates are investing for future growth. Capital expenditures are tracking a 30% increase in 1Q18 (first chart from UBS). Average company R&D spending is near an all-time high (real basis, second chart from Patrick O'Shaughnessy).


It's hard to argue that rallies since January have not been disappointing. Each one has failed right as momentum became "overbought" (top panel). Uptrends are defined by their ability to become and stay overbought as investors chase price higher. Until that happens, this is likely to remain a range bound market where profits are made fading the edges.

There have been five major distribution days so far in 2018 (defined as down volume over 90% of total volume on the NYSE). In contrast, there has not been a major accumulation day since the day before the 2016 election. That "breadth thrust" kick started the rally that followed through 2017. Something similar is needed now. Breadth momentum is now rolling over (lower panel), a near term negative.

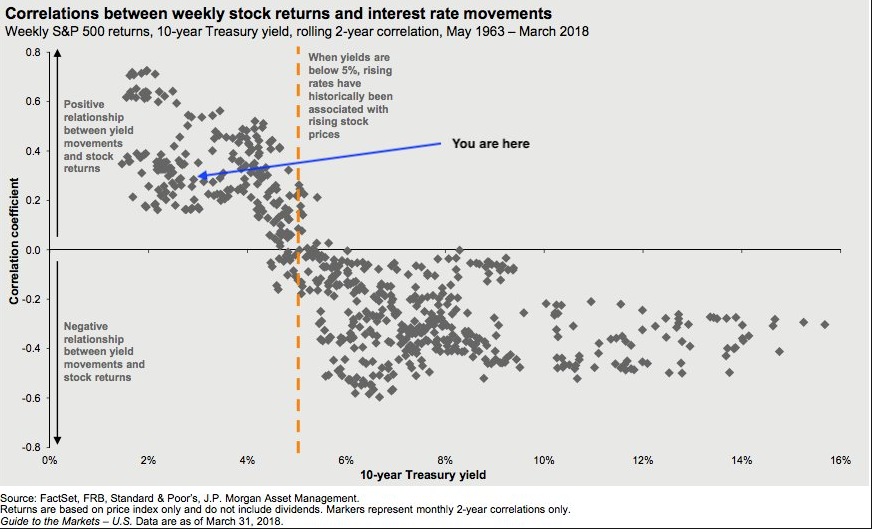
Investors were fretting over a potential trade war in February and March. In April, their primary concern has been rising interest rates. This should not be a concern.
Current 10-year yields are 3%. In the past 55 years, rising yields below 5% have been associated with a rising equity market (from JPM).
The past 18 years are shown below. SPX (top panel) normally rises with yields (bottom panel).

Now, it's true that rising rates killed equities when they rose to 20% in the 1970s, but during the prior three decades (the 1940s, 50s and 60s) when rates were similar to now, equities rose with rates. This made sense to everyone at the time: when the economy and companies are growing faster, there is greater demand for money, so interest rates are higher. And bigger, faster growing profits make companies more valuable (chart from Robert Shiller).

Markets expect the FOMC to continue raising rates this year. There is currently a 92% chance that the FOMC will raise rates in June. This indicates an economy which continues to grow. There have been seven tightening cycles in the past 38 years. The very broad NYSE has peaked after the final rate hike every time since 1980 (when federal funds rates were 12 times higher than today).


In summary, US equities are in a consolidation phase. In the past, these consolidation periods have lasted a half year or longer - so this might continue into summer - although some measures of sentiment are already near a washout. New highs are very likely to still lie ahead in 2018.
US corporates continue to do well. In 1Q18, they are likely to post sales growth of 9% and a new high in margins. Those profits are being reinvested for future growth.
Investors are worried about rising interest rates. They shouldn't be. Rising rates have coincided with rising equity prices as far back as the 1940s.
The macro calendar is dominated by NFP on Friday.
If you find this post to be valuable, consider visiting a few of our sponsors who have offers that might be relevant to you.