All of this said, there are reasons to be on the alert for a retracement of recent gains in August. The SPX consistently reacts negatively as it approaches each "round number" milestone (like 2200) for the first time. NDX has returned to its late 2015 resistance level. Some measures of shorter sentiment are heady. And August is seasonally weak and prone to a larger interim drawdown. Importantly, none of this is likely to be trend-ending.
* * *
In our last market summary at the end of June, the near term set-up was for higher equity prices in July (that post is here). For the month, SPX gained 3.5%. The leader has been NDX, which gained more than 7%. Outside the US, Europe gained 3.6% while emerging markets continued to outperform the rest of the world, gaining more than 5%.
Recall that the Brexit vote knocked 6% off US equity prices to close out the month of June. As we wrote then, non-economic shocks (like Brexit) tend to leave minimal damage to stock indices. In a study of 14 non-economic shocks since WWII, S&P Capital found that US indices bottomed within 6 days and had regained all of the losses within 2 weeks (read more here).
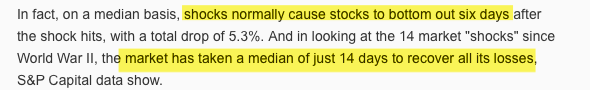
In the event, US indices bottomed on day 2 and regained all of the losses by day 10. In the 3 weeks that followed, the SPX gained another 3%.
The rally over the past month triggered a number of longer term bullish studies. Together with continued pessimism among investors, it is reasonable to expect continued appreciation in US equities in the month(s) ahead. We will review a few of these studies below.
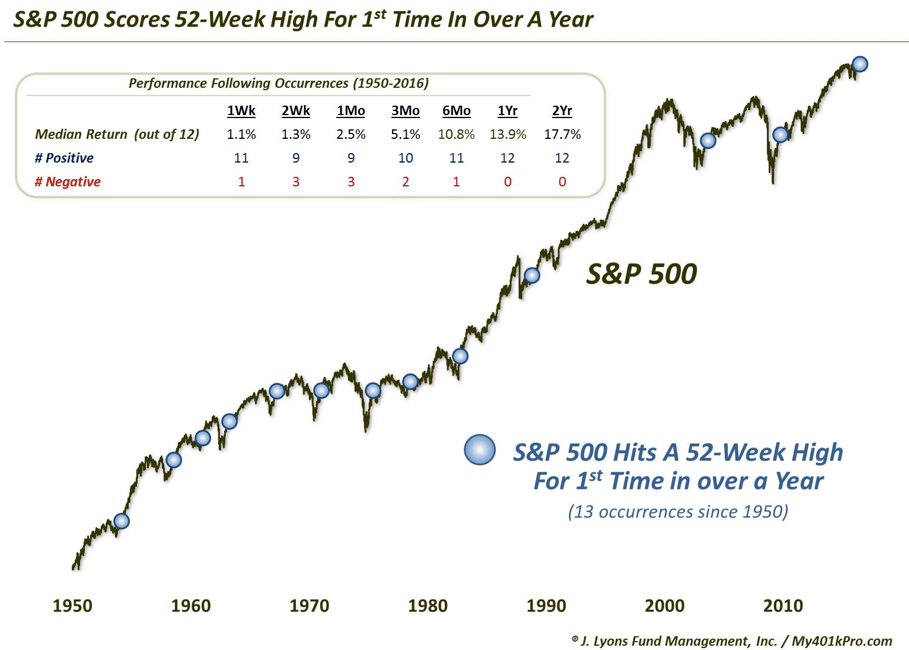
First, the SPX is now trading at a new all-time high (ATH). On its own, this should be considered a bullish confirmation of trend. Since 1950, when the SPX makes a new high after not having done so in the past year, the index has added to those gains more than 80% of the time in the next 3 months and 100% of the time in the next year (data from Dana Lyons).
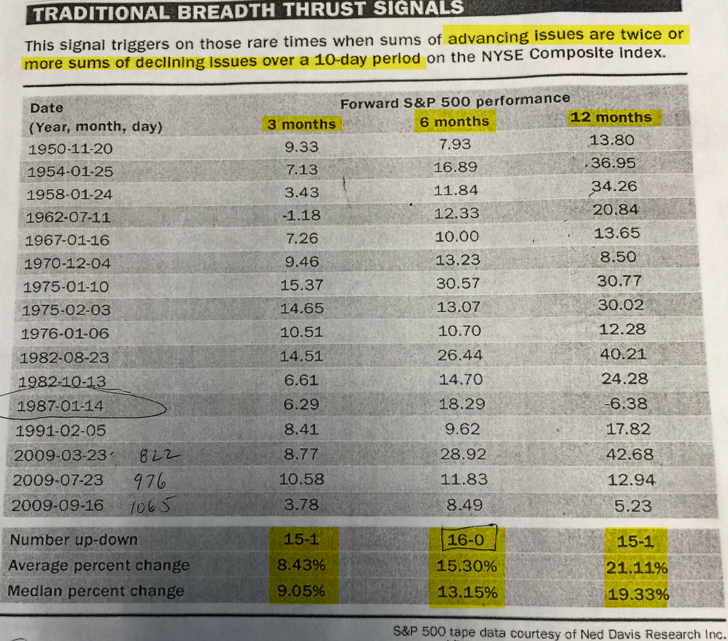
Breadth during the push to new highs has been remarkably strong. Over a 10 day period, advancing issues outnumbered declining issues by more than two times. Similar "breadth thrusts" are rare: there have been only 16 such occurrences since 1950. In every instance, the SPX was higher 6 months later by a median of 13%. Nearly every instance was also higher 3 and 12 months later as well (data from Ned Davis via @inewlin).
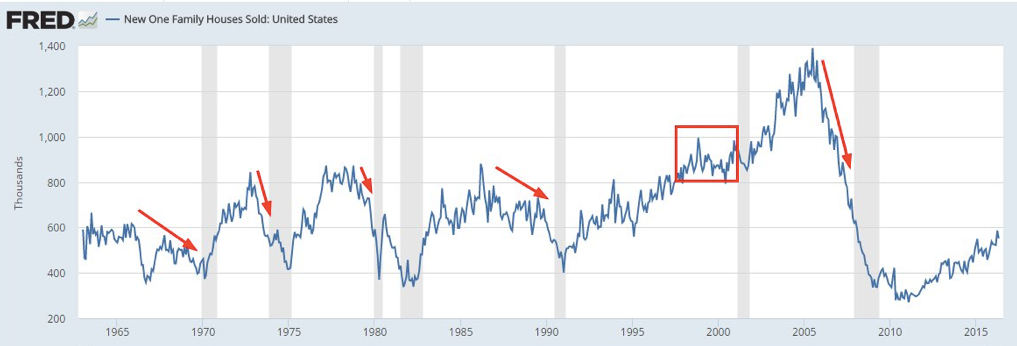
It is fair to say that the push to new highs in equities is supported by resilience in the macro data. New houses sold in the US reached a new 8 year high in June. Home sales and construction are an important driver of employment and consumption; prior to a recession, the pattern has been for housing to cool/decline. This is not yet the case (chart from George Pearkes).
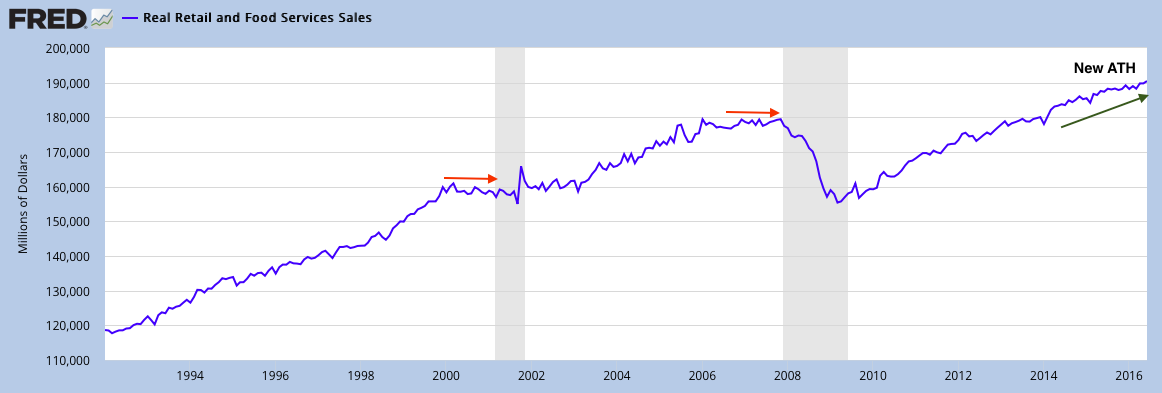
Retail sales, similarly, are at an ATH and not showing any pre-recessionary flattening or weakness.
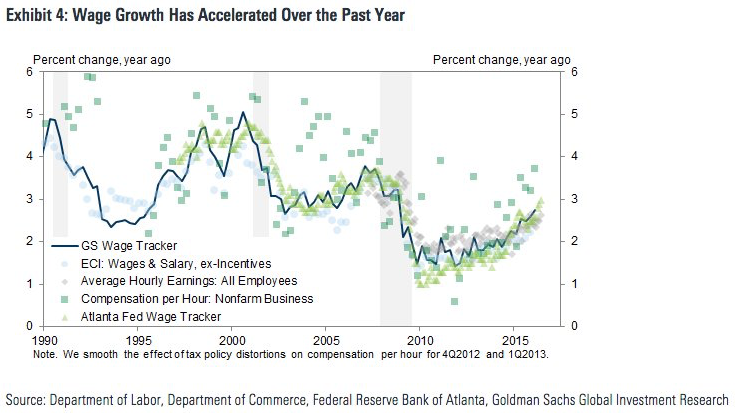
Not only has employment growth of approximately 2% YoY persisted but wage growth has accelerated. Taken together, higher incomes for an increasing number of households should continue to fuel consumption (data from GS via Conor Sen).
A recent post summarizing the latest macro data can be found here.
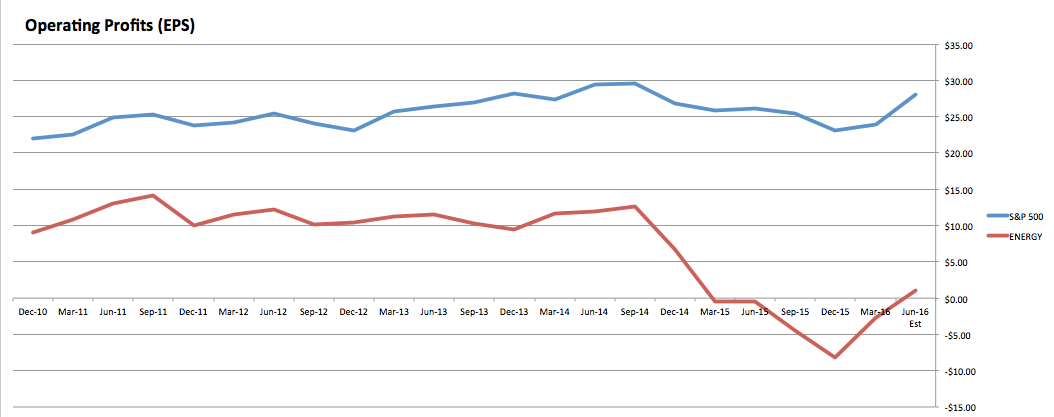
It's also fair to say that new highs in equity prices are supported by an improvement in corporate sales and profit growth. It's still early in the 2Q16 reporting season but earnings are tracking growth of 7% YoY and 17% QoQ. The earnings drag from both energy and the dollar are dissipating (data from S&P).
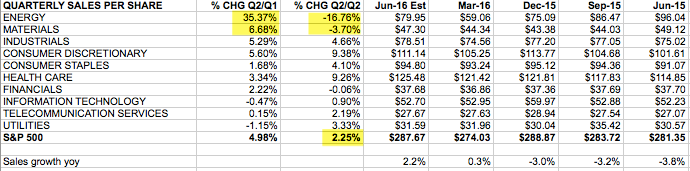
At the sector level, sales growth is in-line with macro growth. Even with the large drag from energy, total sales growth is tracking 2.2% YoY and 5% QoQ. Industrials, discretionary, staples and healthcare are all growing 4-10% YoY. We will have more to say about corporate financials in the next week (data from S&P).
Given the advance in stock prices together with decent macro and financial data, it is surprising how pessimistic investors remain, at least on a longer term basis.
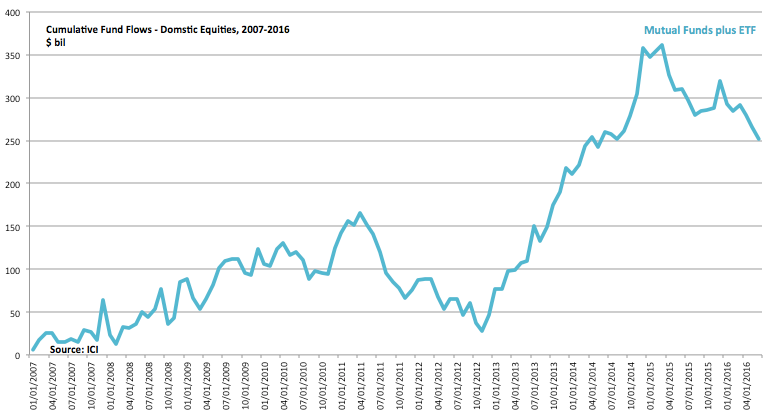
Money flows into equity ETF and mutual funds have been negative 13 of the past 14 weeks, including 3 of the past 4 weeks since the Brexit vote. Money flows have been negative longer than any time during the 2007-09 bear market. Even the bear market rally in March-May 2008 included several positive weeks of equity inflows, including one that was more than $20b in one week. There has been nothing close to this during 2016 and it is hard to imagine this uptrend running into significant trouble until it does (data from ICI, estimated through June).
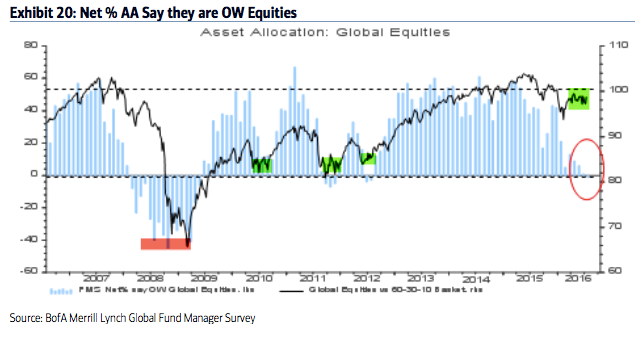
Similarly, the equity allocation of professional fund managers at the end of 2014 was equal to that at the market peak in 2007. That has since been completely unwound: equity allocations are now at the same levels as at market troughs in mid-2010, 2011 and 2012. Despite a 20% rally since February, cash levels are at 14 year highs. Read more in a post from this week here (from BAML).
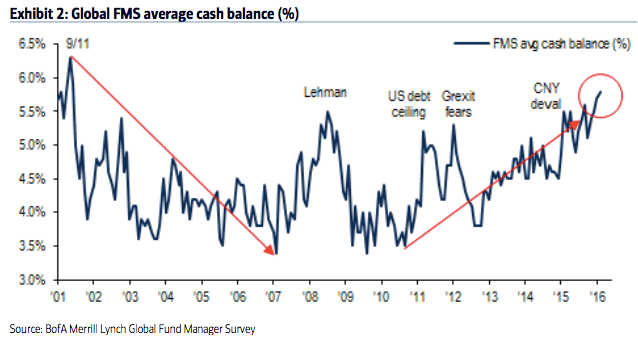
In the chart above, note that current fund cash levels are the highest level since November 2001. US equities gained nearly 10% in the following two months. Equities did not peak and then decline until funds' cash had fallen to under 4%.
Taken together, trend, breadth, macro, corporate financials and investor sentiment imply further gains still lay ahead for equities.
Our best guess is that US equities are in the final "wave 5" of the 7 year bull market. In Elliot Wave terminology, bull markets advance in 5 waves: waves 1, 3 and 5 move higher while waves 2 and 4 are interim corrections. The basic structure is shown below.
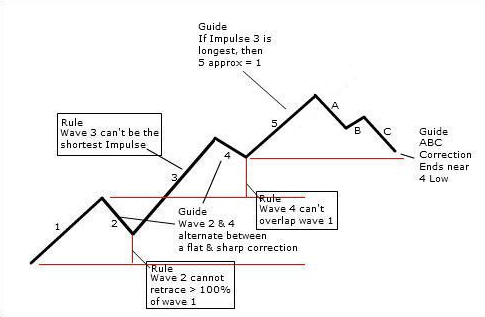
One of the main defining characteristics of this pattern is that "wave 3" is normally the longest. In the current bull market, that would correspond to the long 2011-15 advance. "Wave 2" was the steep 20% correction in 2011 that some consider a bear market. In comparison, "wave 4" is often a "flat" correction: this corresponds to the flat trading range that persisted through much of 2015 and the first half of 2016. The new highs for both SPX and NDX indicate that "wave 5" is now underway.
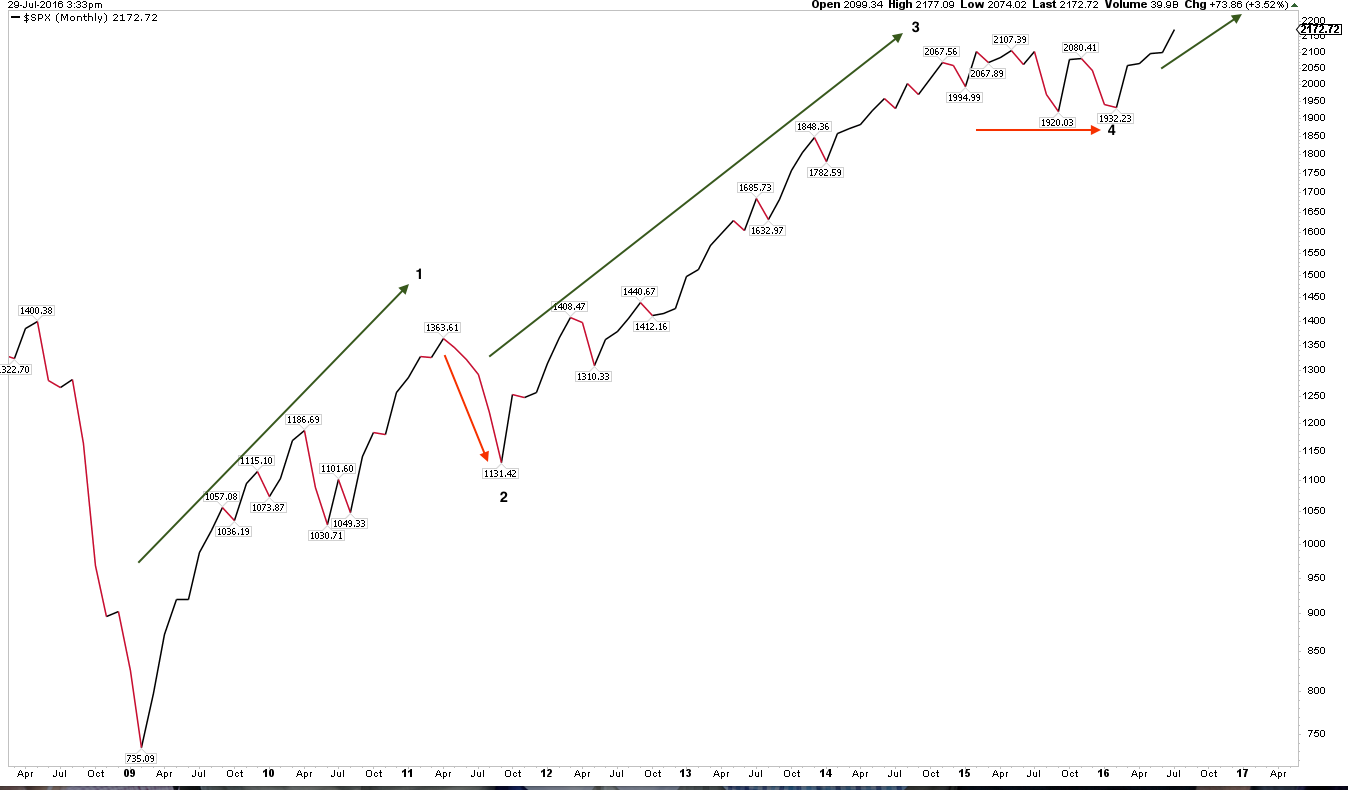
A literal interpretation of this pattern would imply that SPX is headed above 2500, about 20% higher. Instead of a price or calendar target, we think it makes much more sense to monitor the data. "Wave 5" will likely top when sentiment becomes excessively bullish. If waves 1 and 3 are characterized by "skepticism" and "acceptance", respectively, then the final push in a bull market is typically "euphoric". At the 2007 market top, fund managers' equity allocation was nearly 60% overweight and cash was under 3.5%. At the end of "wave 5", we will also start to see employment, housing and various measures of consumption start to flatten and weaken.
Let's now discuss the shorter term.
SPX and NDX traded at new ATHs on Friday. Both are above all of their moving averages, all of which are rising. Clearly, the trend is higher. The first sign of short term weakness is successive closes under the 5-dma, which will then inflect lower. That has not happened.
That said, there are a few things that have us on alert for a pause or reversal during August.
First, SPX closed at 2173 on Friday, about 1% from 2200. SPX has had a consistent tendency to correct as it approaches each new "round number" milestone for the first time. The smallest reaction (2%) was in 2013 at 1800. Most often the reaction is more than 3%. The last two were 10% (at 2000) and 6% (at 2100). A move to the Bollinger middle band implies a correction of about 4%.
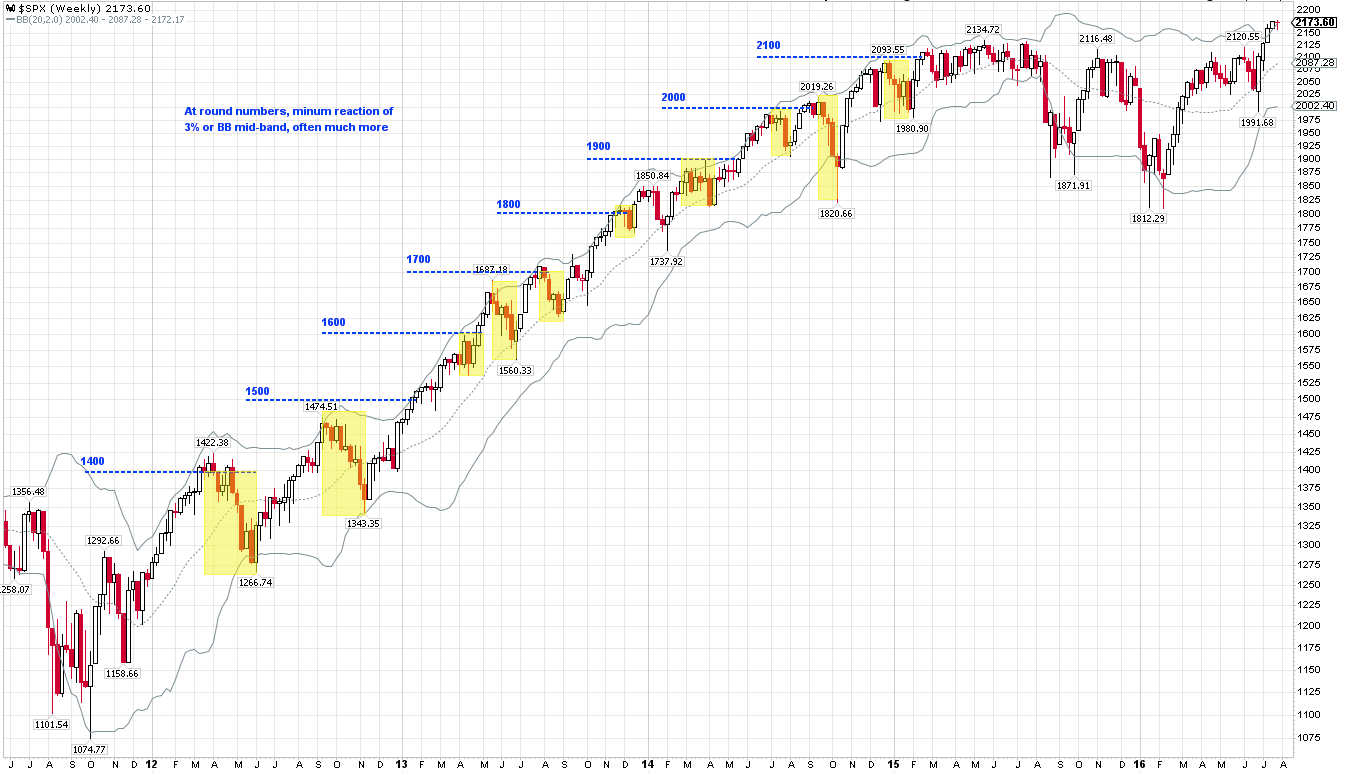
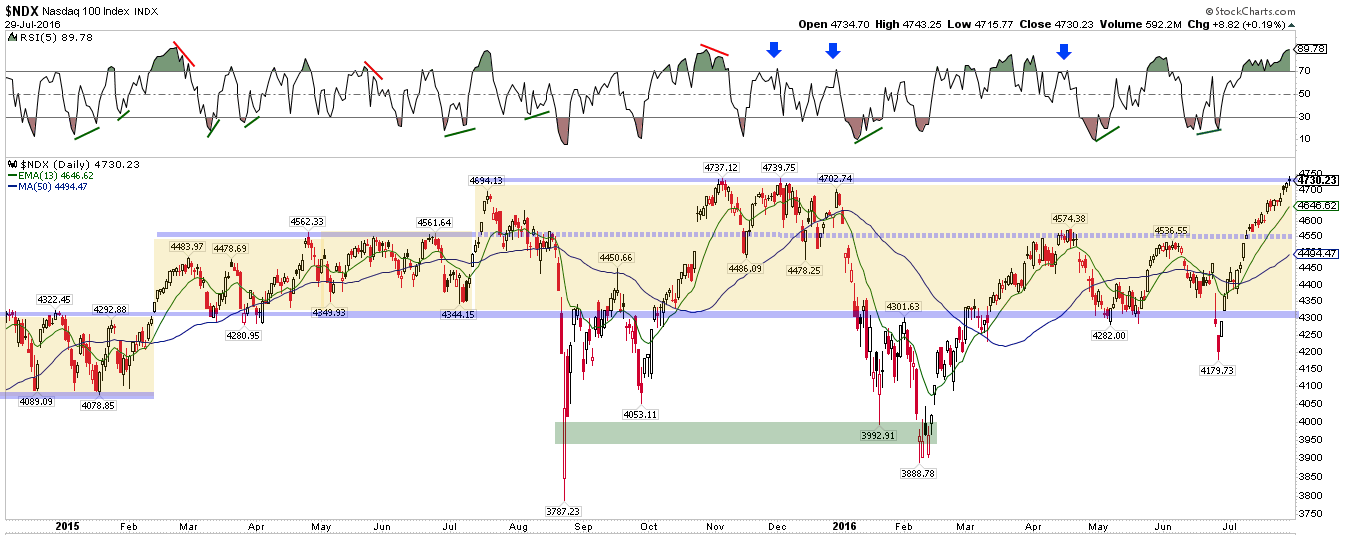
A reaction near 2200 in SPX may be more likely now that NDX has returned to the 4700 area which was strong resistance on 3 occasions in late 2015. Some hesitation at this level would be normal. Moreover, daily RSI (top panel) is 90; in the past, a move to the 13-ema (green), through price or time has often followed.
A second reason to expect a reaction in August is shorter term sentiment has gotten heady. To take one example, active investment managers surveyed by NAAIM are now more that 100% long. This has only happened 4 times in the past, so historical data is limited, but the last two times were followed by reactions of -2% (November 2013) and -4% (February 2015). In all 4 cases, SPX continued to move higher in the weeks ahead; any reaction was relatively minor (green lines).
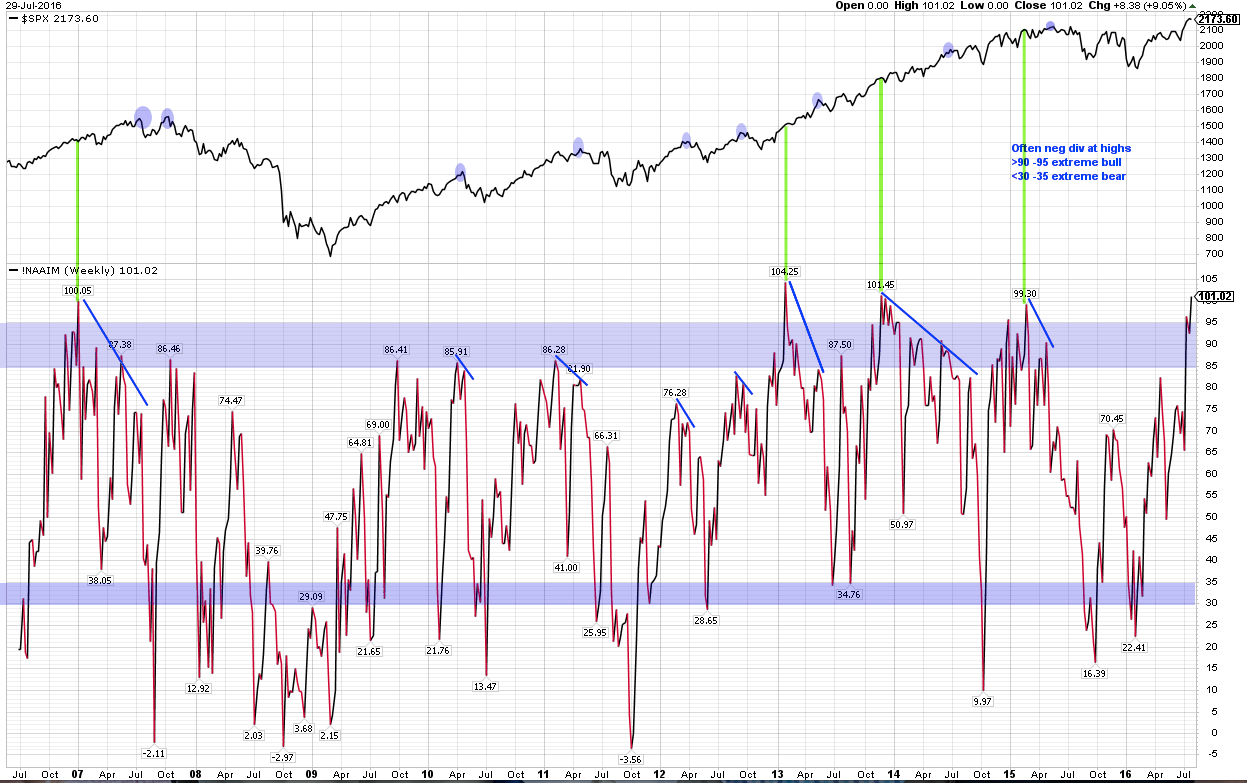
Excessive bullish sentiment is often a less reliable contrarian indicator than excessive negative sentiment. NAAIM managers were more than 100% long equities in January 2007; the SPX moved more than 10% higher over the next 11 months before the start of the 2008 bear market (left side of the chart above).
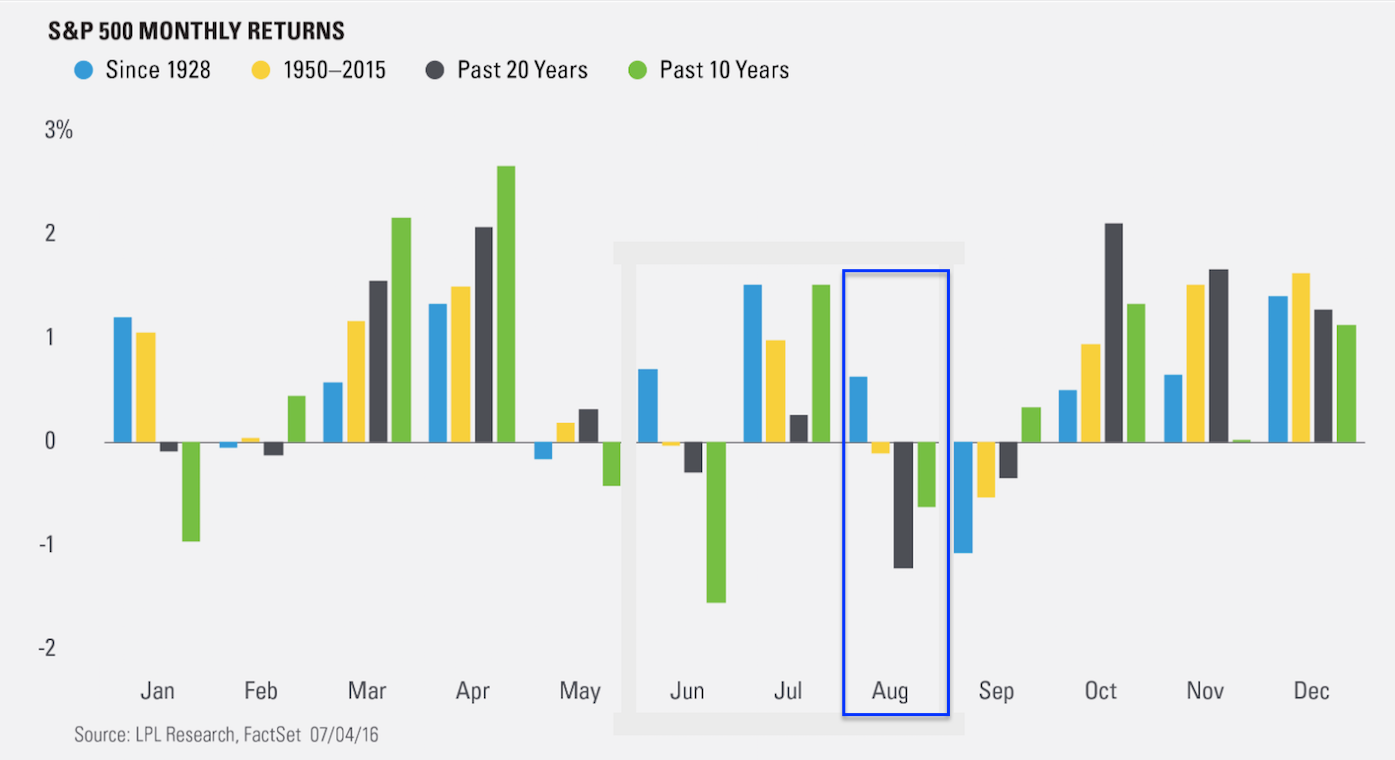
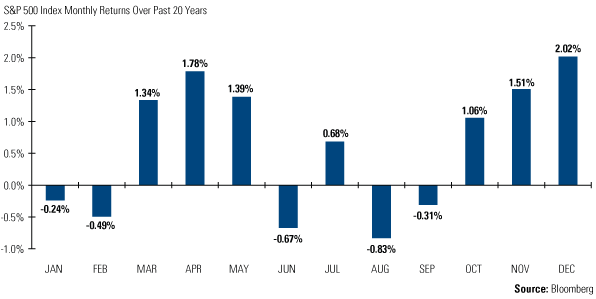
An third reason to expect a reaction in August is that the month is seasonally weak and often volatile. Recall that July is typically the strongest month of the summer. In comparison, August is one of the weakest months, especially over the past 10 and 20 years (data from Ryan Detrick and Bloomberg).
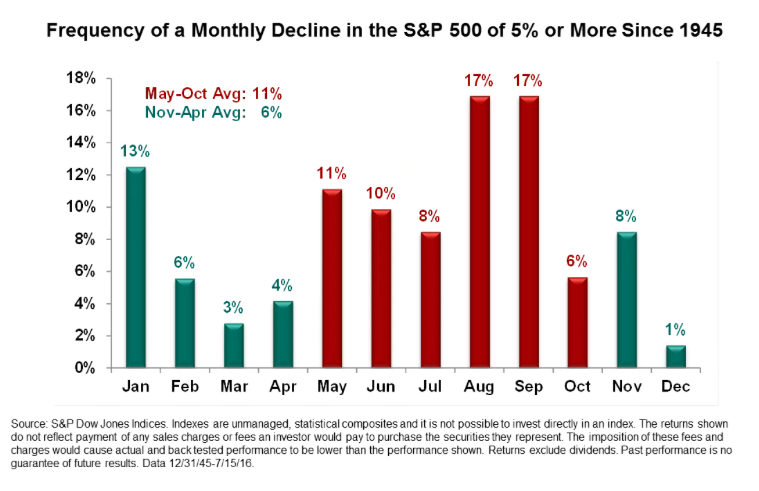
But what sets August (and September) apart is not that the month ends badly but that the interim drawdown within the month can be severe. A 5% decline in August (or September) is nearly twice as likely as during any other month (data from Sam Stovall).
Interim drawdowns in the summer are typical. In April we advised to not simply "sell in May"; more often than not, investors end up buying back higher in November. But larger drawdowns are more than twice as likely in the summer as during the winter, and August and September are the two worst months (read more here).
A final note on seasonality: since 1993, SPX has gained more than 2% in July on 8 occasions. It added to those gains in August just 3 times, one of which by a mere 0.4%. In other words, strength in July has most often been followed by a retracement in August.
In summary: US equities are trading at all-time highs. The trend is higher, supported by strong breadth, resilient economic data and improved corporate financials. Even after the strong advance, longer term measures of sentiment continue to show skepticism among investors. Together, this is a set up for higher equity prices in the month(s) ahead.
All of this said, there are reasons to be on the alert for a retracement of recent gains in August. The SPX consistently reacts negatively as it approaches each "round number" milestone (like 2200) for the first time. NDX has returned to its late 2015 resistance level. Some measures of shorter sentiment are heady. And August is seasonally weak and prone to a larger interim drawdown. Importantly, none of this is likely to be trend-ending.
If you find this post to be valuable, consider visiting a few of our sponsors who have offers that might be relevant to you.