* * *
US equities rose for a second week in a row. SPY was up 1.7%, the Dow was up 2.3%. In contrast, NDX was up just 0.5%.
The biggest winner was once again oil, which rose more than 4% this week. Since it's low 10 days ago, oil has risen more than 20%. There is little doubt that this has had an outsized positive affect on US equities.
The longer term technical picture remains bearish for SPX. It made a lower high in November and a lower low in January. The 20-wma (blue line) is sloped downward, as it was in 2008 but also in 2010 and 2011. The pattern is bearish until SPX at least exceeds the prior high in November (2120 area): this is what separates 2008 from 2010 and 2011 (horizontal lines).

Bullish markets become overbought; bearish markets do not. The market is now at a point where it will show its character. In the chart above, the rebound in early 2008 failed to reach overbought momentum, in contrast to 2010 and 2011 (upper panel arrows).
The same is true on a daily time frame. Support from August and September held and the index has since gained more than 4% (closing basis). Momentum is just below overbought; this is right where every rally since October has failed, and also where the rally in mid-September failed (upper panel). A key test for SPY is upon us.

The short term pattern has improved. SPY's 13-ema and 5-dma are now trending higher. There's a new "step" higher in the pattern. The rebound has now retraced about 38% of the drop from November: a weak rebound usually gets no further than this. A rebound to the 62% Fibonacci near $200 remains a distinct possibility (described in detail last week here).

In the chart above, note that short-term momentum is now very overbought; it would be unsurprising if SPY retested the 192-193 area early in the week (chart below, green line). The weekly pivot is 191.6. 195 should be stiff resistance (blue line).

NDX is not confirming the longer term bearish technical pattern in SPY. The index made a higher high December and a higher low in January. It's 20-wma is not declining. Still, the index needs to regain the 4500 area or the risk is that it too will rollover lower.

For NDX, the 4350 area will be a key test: this is where rallies have failed (late 2014, early 2015, September 2015). The same comment on momentum from SPY also applies to NDX (top panel).

Price aside, there were two other positives the past two weeks.
First, there were breadth thrust days on both Tuesday and Friday. This means that volume on the NYSE was 90% positive. It's rare enough to have a single breadth thrust day. Two in one week is exceptional. Equities have a strong tendency to add to gains in the weeks ahead. Below are returns after a single 90% up day; returns over the next month and longer are very good (data from BAML).

When there are two breadth thrust days in a week, the returns are even better, as shown below, although the market becomes overbought short term and therefore due for a rest (data from Rob Hanna in a post here).

The second positive is that, although the market is up over the past two weeks, investors remain exceptionally bearish. A rising market where investors are slow to buy the dip often pushes higher.
Recall from last week's post that $46.5b had flowed out of equity mutual funds and ETFs in the past 8 weeks. There was another $1.2b outflow this week, making flows negative 8 of the past 9 weeks. In the last 13 years, the only comparable periods were early 2008 and mid-2011. The 2011 low marked the start of a new bull leg. Even in 2008, SPY rose 8% over the next several weeks before faltering. A similar rise now would take SPY to about $200.
Investors have been on the defensive. $3.8b went into treasury funds this week, making it the 7th week in a row for inflows. A massive $13.9b went to money market funds this week alone.
Focusing just on flows into TLT, the past 10 days has seen the largest inflow ever, by a wide margin (lower panel). Prior extremes have tended to be near turning points in TLT (upper panel; data in the next two charts is from Sentimentrader).

What is a positive extreme for TLT tends to be a negative extreme for SPY. Using the same data, SPY has done well after these same extreme fund flows into TLT (SPY is in the upper panel).

Similarly, investors in Rydex funds have one of the largest percentage of their assets in bearish equity funds and in money market funds as a percentage of their total assets in the past 10 years. This too has marked near term lows in equities (chart from Cam Hui).

The Citibank Panic/Euphoria model, which we have referenced in the past (a longer term chart from September 2015 here), is now at the lowest level in many years, from which SPX has never been lower over the next 12 months and has most often gained more than 10%.

The percentage of AAII bulls sank to the lowest decile in late January, from which SPX has been higher 1 and 3 months later by 2.3% and 5.3%, respectively. Forward returns are positive during these time periods 70% and 85% of the time, respectively (data from Charlie Bilello).

The market timers with the best investment records over the past 1, 3, 5 and 10 years are bullish on equities, while those with the worst track record are bearish (article from Mark Hulbert here).

The biggest potential negative remains the outsized influence of the price of oil on equities. The tick for tick correlation between the two lessened as the week went on, but the overall pattern remains in sync. There's little doubt that the rally the past 10 days has been sparked by the 22% rise in oil.

The same is true for junk bonds.

January ended with SPY lower by 5%. December was also lower. Does the combination of a failed Santa Rally (SCR) and a lower January (JB) lead to bearish results for the rest of the year? The answer is no. When those two have both happened in the past, SPX has been higher the rest of the year 5 out of 8 times (data from Stock Almanac).

That said, the probability of a positive end to the year is lower than when January is up and the return for the year is normally below average (data from Mark Hulbert).

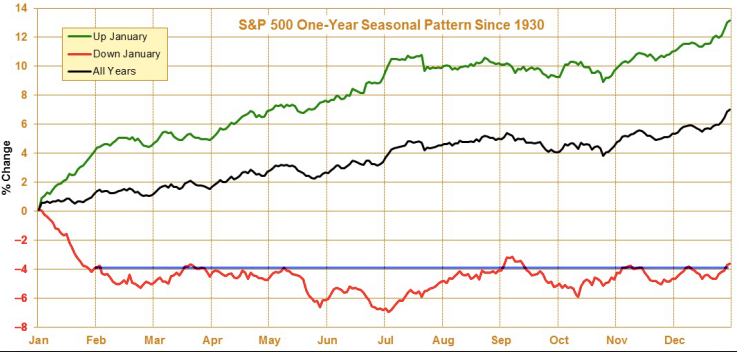
If past is prologue, equities will chop sideways the next 3 months and then make a lower low in early summer, from which the best rally of the year will take place (red line). A difficult market environment might remain for the time being (data from Stock Almanac).
This is another big week for earnings, after which we will have a very good grasp on how companies are performing. Companies can engage in buybacks after reports are issued, a potential tailwind.

On the economic calendar, personal consumption data is Monday, auto sales on Tuesday and the all-important payroll report is on Friday.
Equities ended the past week fairly overbought on a short-term basis. Some give back early in the week would be unsurprising. But there were two breadth thrusts this week, and investors remain very bearish, two tailwinds as we enter into the month of February.
If you find this post to be valuable, consider visiting a few of our sponsors who have offers that might be relevant to you.